In Part 1 of this series, I explained the basics of how to read a black and white histogram. “But I take color photos!” you might be saying. Most of us do these days, at least some of the time. So how can we apply the lessons from the previous article to color photography?
The answer is much simpler than you might think.

When your camera appears to be taking a color photo, it is actually taking three black and white photos at the same time. Your camera works in a color system called RGB, which means that all of the visible colors are made by mixing three primary colors: Red, Green, and Blue (which works with light, even though it doesn’t work with paint). The camera’s sensor has three corresponding types of receptors, which are arranged in a specific pattern on the sensor’s surface, generally with about twice as many green receptors as red or blue. Consequently, your camera takes a black and white picture (ie, just recording lightness and darkness) with the red sensors, one with the green sensors, and one with the blue sensors, and each is saved as a color channel. The channels are then mixed and displayed as color by the software in which you’re editing the photo; in this case, Photoshop.
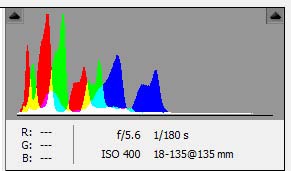
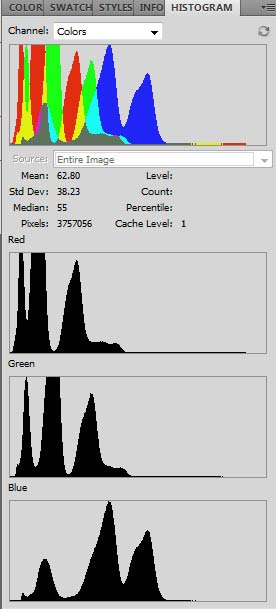
How do histograms display all of this information? Usually, they combine the data from all three channels and display it on a single histogram (the RGB histogram). In some cases (on many cameras these days), the channels are color-coded in the combined histogram, so you can see which data is from the red channel and which is from the blue channel.
However, it may be easier to make sense of the histogram at first by looking at channels separately as well. Some cameras give you the option of displaying three separate histograms after you’re taken a picture, which can be very useful if you’re not accustomed to reading the combined display. When looking at the channels separately, each histogram is exactly like the black and white histograms that we saw in the previous article.
In fact, I may be beating a dead horse at this point. Once you understand how a single histogram works, and you know that an RGB color image is made up of three channels and therefore has three histograms, there’s nothing particularly difficult to understand here.
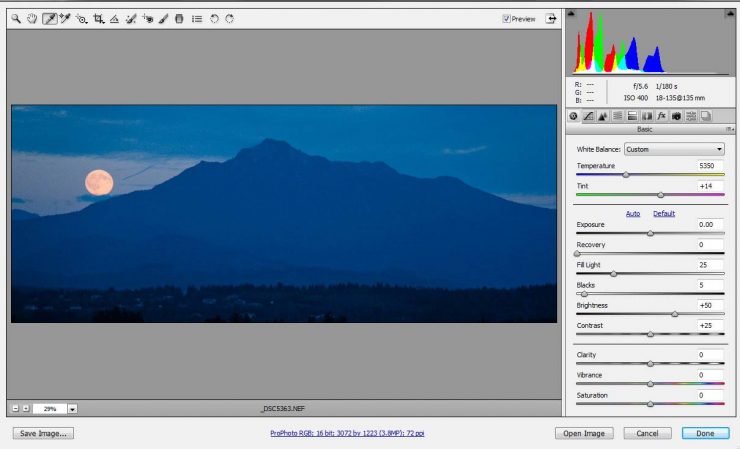
What Do I Do With This Information?
Now you understand what a histogram is and how to read it, whether color or black and white. So what? How does that improve your pictures? That is a slightly more complicated, but very important. It is also the subject of the third article in this series.

